Thinking Geographically about Congregational Ministries
Maps can help your congregation learn about itself, set ministry priorities and connect to the global church.
“You will be my witnesses in Jerusalem, in all Judea and Samaria, and to the ends of the earth” (Acts 1:8).
As a Calvin College geography professor, I love poring over maps and making my own maps. As a Christian, I owe my conversion to a Lutheran church in Minneapolis that took its geographic setting seriously—so seriously, in fact, that it ran after-school programs for kids at the public school across the street and hired a youth leader to work with local unchurched kids.
So when I visit new churches I look for maps on the walls of fellowship halls. Two types of maps are most common: the world map with pushpins for various missionaries supported by the congregation and a local street map with pushpins indicating the homes of church members. What I like about these maps is that they show that the congregation is thinking geographically. They show that the church cares about the world beyond their doors, that they are taking their place seriously, and are engaging their mission at both the local and the global scale. This is quite biblical. Jesus’ last recorded words, found in Acts 1:8, lay out a geographic framework for the church’s ministry, encompassing the local and the ends of the earth. Here are some ideas for thinking geographically about congregational ministries.
Going Local
“The Word became flesh and blood, and moved into the neighborhood” (John 1:14, The Message).
In the second half of the twentieth century, changes to cities wrought by the automobile and the expressway promised liberation from the friction of distance and constraints of place. Similarly, religious changes, innovations, and fragmentation gave religious consumers an increasing range of choices. These changes to cities and churches combined to loosen the relationships between congregations and places. However, there has been some recent rediscovery of the parish tradition’s deep connections between religious practice and place. Pastor Randy Pope of Perimeter Church in Atlanta, a pioneer of the multi-site church model, stopped doing satellite services because he believes congregations should be particularized to a locality. Like the Lutheran church whose outreach drew me in, the advocates of the “new” parish model are realizing a call to the unchurched and dechurched who live nearby. In part, this rediscovery of the parish model is driven by recognition of the need for more intense forms of community in order to live the Christian life in an increasingly hostile post-Christian culture (Dickau 2011; Sparks et al. 2014). Other congregations are rediscovering the value of their local setting as a significant percentage of millennials have a preference for walkable urbanism (Speck 2012) and indeed all things local such as locavore foods and local craft beers (Knox and Mayer 2009).
As congregations try to go local, the pushpin map of members proves incredibly useful. One variation is color-coding the pushpins to look for patterns. Imagine one color of pushpins for existing members and a different color for new members. Where do the new members live? Are they closer or further from the church than the existing membership? Or imagine color-coding the pins by age group. I know of many inner-city churches with an adult membership that drives in from the suburbs while the youth group comes from within walking distance. Some urban congregations, like mine, have older, long-term members driving in from the suburbs while younger families are buying and renovating older houses in the city and walking to church.
A street map covered with pushpins depicting your church’s membership is a treasure trove of geographic data. But when simply looking at a map covered with placemarkers, it can be hard to distinguish patterns and general tendencies in the data. Our eyes are drawn to the extremes. When I’ve interviewed pastors about their church’s attendance area, they will often share anecdotes about the one family who drives across the metropolitan area to attend their church. Of course, it’s flattering that people would travel so far to our church. But that family might be the exception rather than the rule.
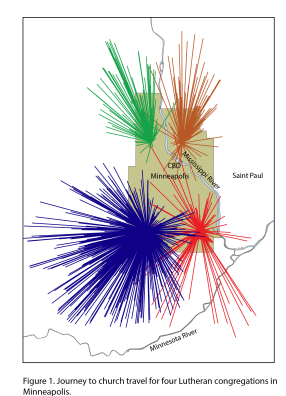 New possibilities emerge when we go beyond the paper map into the digital realm of geographic information systems (GIS). In a GIS, thousands or tens of thousands of addresses can be mapped almost instantaneously, and GIS technology opens up a wide range of additional analytical tools. We can determine the mean or median location of a group of points, which could help us identify an optimal new location or see how the congregation has moved over time. We can also calculate the percentage of members traveling different distances and visualize the direction of travel with diagrams that connect trip origins and destinations (Figure 1). Or we can calculate the density of members per unit area or the density as a percentage of the local population (Figure 2). These GIS techniques and map visualizations give us a better
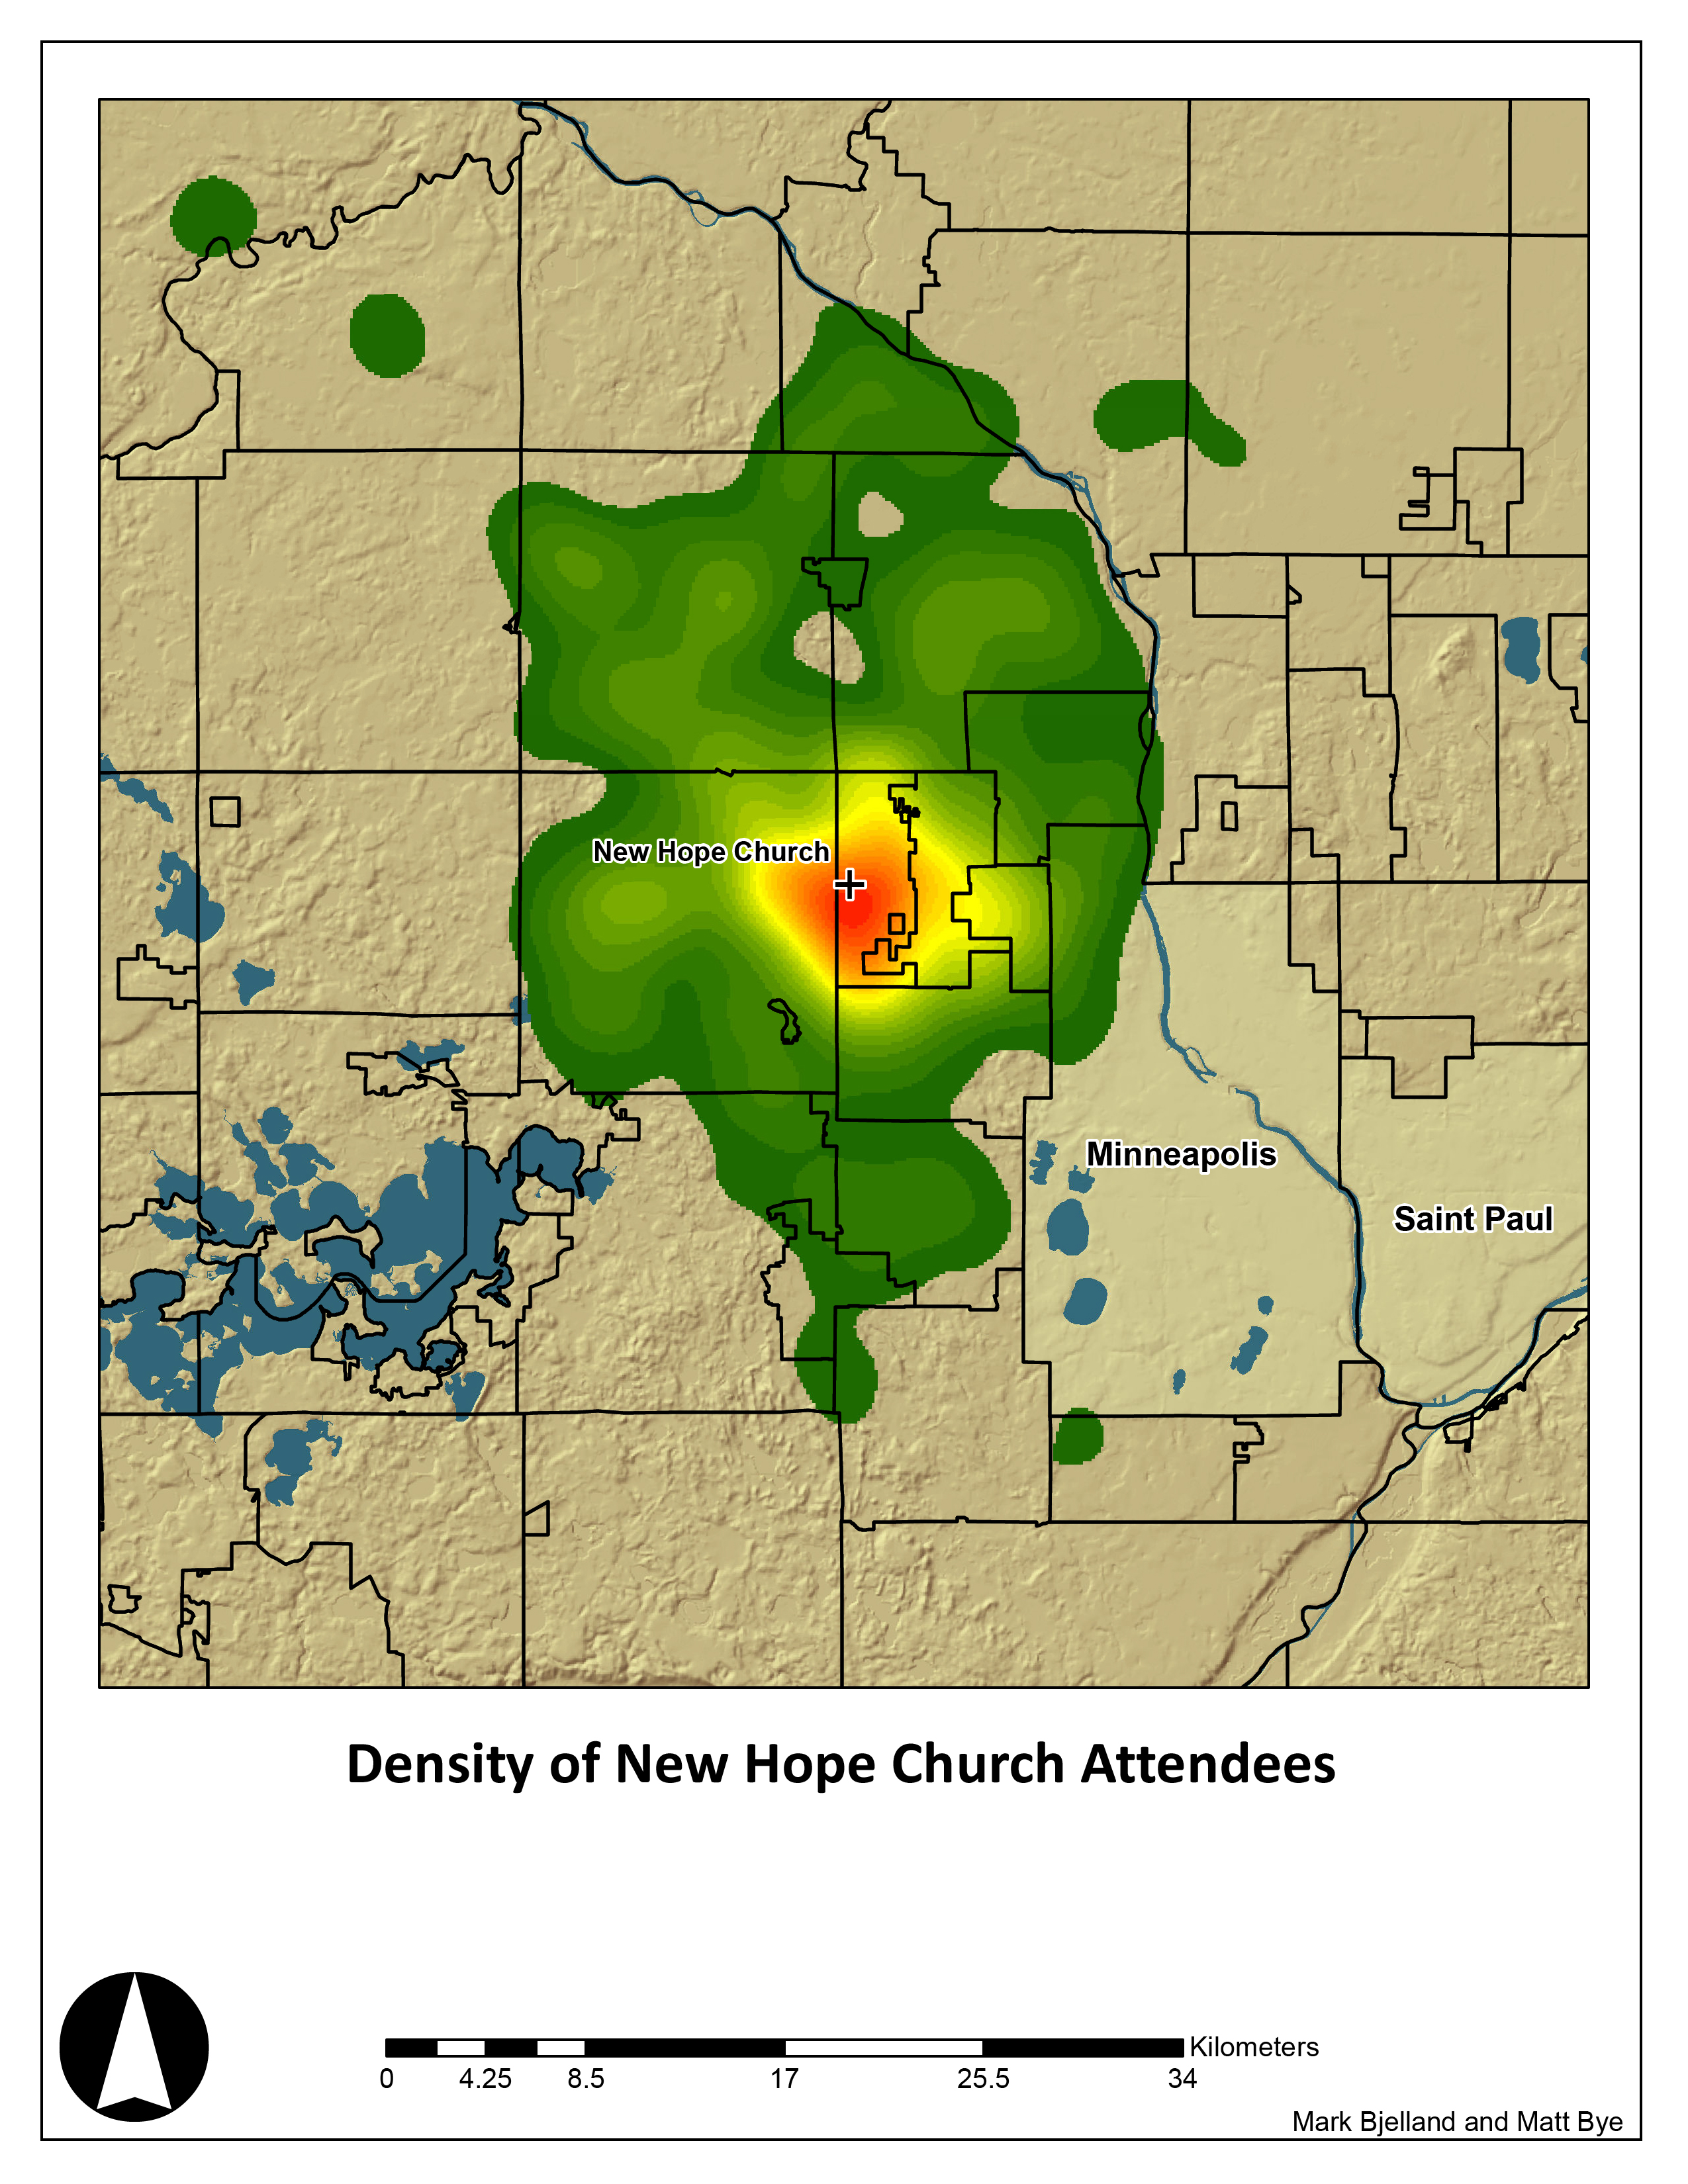 picture of the relationship between a congregation, its members, and its urban context. They are useful for distinguishing parish and commuter congregations, those that draw regionally and those that appeal to a particular segment or sector of the region. But they say little of the depth of engagement, place knowledge, and lived experiences that can be better explored using other methods.
Mapping Local Knowledge
We don’t need to limit our mapping to plotting member addresses on street maps. One church outreach director displayed an enormous aerial image of the area surrounding the church on her office wall. Then, she started filling in the map with the names of people she met on her walks or those who attended the church’s outreach events. The map became a tool for strategic thinking and prayer. I can imagine adding photos, literally putting faces on the map. Other congregations have filled fellowship halls with maps depicting issues of community concern such as the location of shootings in the surrounding area or community assets and ministry partners such as schools, homeless shelters, food pantries, and other churches.
Another mapping exercise is to ask pastors and congregants to draw maps of the surrounding community from memory. The idea is to elicit their mental map of the area. A mental map elicited through a sketch map can give us a picture of a person’s experience of that place and their everyday life. Geographers, environmental psychologists, and other social scientists regularly use mental mapping techniques. Researchers used mental maps along with photo diaries and other visual methods to understand the lives and activity spaces of street children in Kampala, Uganda. They found that even children who don’t attend school enjoyed drawing maps, and the act of drawing the map itself brought out rich narratives because our memories are attached to places (Young and Barrett 2001).
In my own work, I’ve begun to experiment with using mental mapping techniques to understand a congregation’s local knowledge. A church that is targeting outreach to its local community, for example, could use a mental mapping exercise to discover what congregants know and don’t know about the local area.
Going Regional
Mapping can also help congregations connect to the broader church of Christ. Each Sunday my home church prays for two other Christian Reformed churches within our classis (the regional organizational body) and is prayed for by other congregations within the classis. But wouldn’t it be more consistent with the character of the kingdom of God if that circle of prayer were expanded to include the nearby Missionary Baptist congregation.
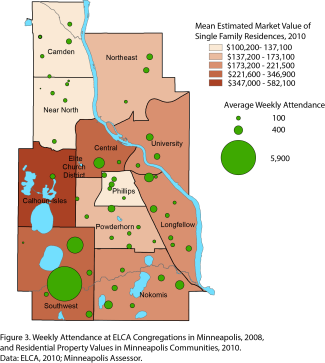 At the same time, mapping can help denominations understand their congregations. In a project for the Evangelical Lutheran Church in America, my students and I created maps depicting the average weekly attendance in all Lutheran churches in Minneapolis (Figure 3). We learned, for example, that the two largest Lutheran congregations were right next to each other, and the three largest Lutheran congregations were located in upper-middle class settings even though most Lutheran congregations were found in poorer communities.
Going Global
World maps on church walls are great reminders that our world belongs to God, that the church is called to be Christ’s witness to “the ends of the earth,” and that in the new creation people from all nations will stream into the city of God. Mapping one’s missionaries is a great place to start. But what about displaying maps of the global distribution of Christianity, unreached people groups, and religious persecution? Jason VanHorn, one of my geography colleagues at Calvin College, has created a web mapping application for such data for the Joshua Project.
I wonder whether most North American Christians know that many of their praise songs come from Hillsong Church in Australia, or that many of our contemporary hymns come from Keith Getty, Kristyn Getty, and Stuart Townend of the United Kingdom. But why does it matter? Knowing the different geographic contexts our songs come from can help us develop a more global sense of God’s kingdom. Furthermore, knowing the geography and the history of our songs can enrich their meaning. Take the popular contemporary worship song “Build Your Kingdom Here” by Rend Collective Experiment as an example. I find the meaning of the line “Show your mighty hand; heal our streets and land” is enhanced when one knows that the lyricists come from the long-troubled land of Northern Ireland. The hymnal Lift Up Your Hearts, a joint publication of the Christian Reformed Church in North America and the Reformed Church in America, is a wonderfully diverse collection that includes songs with Western origins and music from the global church. Another of our ongoing projects in the geography program at Calvin College is building an interactive map showing where the hymnal’s songs were written.
Some people show a look of pity when they hear that I am a geographer. “Hasn’t everything been discovered and mapped?” they seem to be thinking. Well, yes, the age of exploration has long ended, but the everyday lives and worlds of individual believers and churches have yet to be mapped. I hope these thoughts will inspire your cartographic creativity.
References
Dickau, Tim. 2011. Plunging into the Kingdom Way: Practicing the Shared Strokes of Community, Hospitality, Justice, and Confession. Eugene, OR: Cascade Books.
Knox, Paul and Heike Mayer. 2009. Small Town Sustainability: Economic, Social, and Environmental Innovation. Basel: Birkhäuser.
Pope, Randy. 2015. “3 Reasons We Stopped Doing Multisite Church.” Leadership Journal. Summer issue.
Sparks, Paul, Tim Soerens, and Dwight J. Friesen. 2014. The New Parish: How Neighborhood Churches Are Transforming Mission, Discipleship, and Community. Downers Grove, IL: IVP Books.
Speck, Jeff. 2012. Walkable City: How Downtown Can Save America, One Step at a Time. New York: North Point Press.
Young, Lorraine and Hazel Barrett. 2001. “Adapting Visual Methods: Action Research with Kampala Street Children.” Area 3(2):141–152.